Road accident data collection started in some jurisdictions in Australia in 1911 and the first national publication started in 1925 [1]. Between 1925 and 2003, over 171,000 road users lost their life [2] and over 2.2 million road users were injured [3] around Australia. Since the introduction of the first seatbelt legislation in Australia in 1970, law makers have sought a range of measures to educate the public and reduce the road toll. The first seatbelt legislation passed in Australia in the year of the highest recorded road toll, 3,798 deaths. That was an average of nearly 10.5 deaths around the country every day of the year.
Since 1970, various education campaigns and improvements in vehicle design and road safety have significantly reduced the accident risk of driving and the associated road toll. The trend in road deaths in Australia from when national records around 90 years ago is shown in Figure 1.
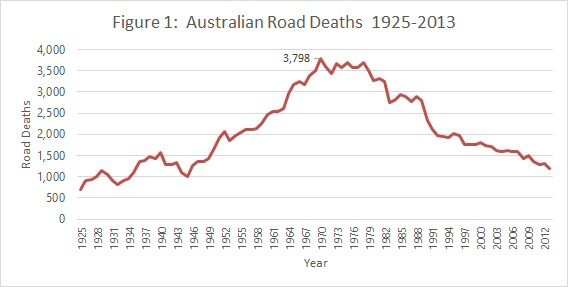
Source: [2] and www.bitre.gov.au/statistics/safety/fatal_road_crash_database.aspx - Accessed: 21/05/2014
In the last 10 years, the total number of fatalities on the road in Australia has dropped from around 1,600 in 2004 to 1,200 in 2013. Although a reduction of 400 fatalities per year is a big improvement, 1,200 fatalities per year is still very high with an average of around 3 people losing their life every day across the country .
Looking more closely at the number of cyclists that die on the roads each year, the number was 43 in 2004 and 50 in 2013. A summary of the national road toll for the last 10 years is provided in Table 1.
Table 1: Road Fatalities in Australia 2004 to 2013
|
Year |
Total Fatalities in Australia |
Total Bicycle Fatalities in Australia |
Number of Bicycle Fatalities Involving a Truck or Bus |
||
|
2013 |
1,192 |
50 |
4.2% |
11 |
22% |
|
2012 |
1,299 |
33 |
2.5% |
4 |
12% |
|
2011 |
1,277 |
34 |
2.7% |
8 |
24% |
|
2010 |
1,353 |
38 |
2.8% |
12 |
32% |
|
2009 |
1,491 |
31 |
2.1% |
4 |
13% |
|
2008 |
1,437 |
28 |
1.9% |
8 |
29% |
|
2007 |
1,603 |
41 |
2.6% |
15 |
37% |
|
2006 |
1,598 |
39 |
2.4% |
8 |
21% |
|
2005 |
1,627 |
41 |
2.5% |
7 |
17% |
|
2004 |
1,583 |
43 |
2.7% |
12 |
28% |
|
Total |
14,460 |
378 |
2.6% |
89 |
24% |
Source: www.bitre.gov.au/statistics/safety/fatal_road_crash_database.aspx Accessed: 21/05/2014
The data in Table 1 shows that there is a clear downward trend for overall road deaths however there was no apparent change in cyclist road deaths over the last 10 years. Between 2004 and 2013, the overall average of cyclists fatalities averaged around 2.5% to 2.8% of total fatalities with an average of 2.6% in the last 10 years. The exception was the number of cyclist fatalities in 2013 which increased to 4.2% of the total well above the 10-year average. Of the total cyclist fatalities, in the last 10 years, an average of 24% of all fatalities involved a truck or a bus.
Injury data for a 12 month period during 2006 and 2007 was investigated in detail as part of a study published in 2009 by Geoff Henley and James E Harrison [5]. The report concluded the following:
“For traffic (on-road) accidents, 49.5% of those seriously injured were car occupants, 22.3% were motorcyclists and 14.6% were pedal cyclists.”
“For the period from 2000-01 to 2006-07, there was an increase of 47% in age-standardised rates of serious injury for motorcyclists and an increase of 47% in rates for pedal cyclists. All other modes of transport recorded only relatively small changes in rates over this period. A similar pattern was seen for those seriously injured with high threat to life injuries.”
When this was compared to Australia’s mode share for cyclists of around 1.5% for commuter trips and around 5% trips other than work or study [6], or even in looking at the percentage of people that identify as cycling in the past week (17.8% in 2013 [7]), the percentage of people that were seriously injured while riding bicycles was well above the proportionate level of trips.
While more detailed investigation would be required to fully understand the reasons behind the increase in the cyclist injury rate, o n congested inner-city streets where cars, trucks, buses and cyclists all share the road, their size can make cyclists difficult to see, especially for drivers of trucks and buses which have large blind spots. A common occurrence is a cyclist travelling through stationary traffic and entering a blind spot from behind, in a location that is often unexpected for the driver.

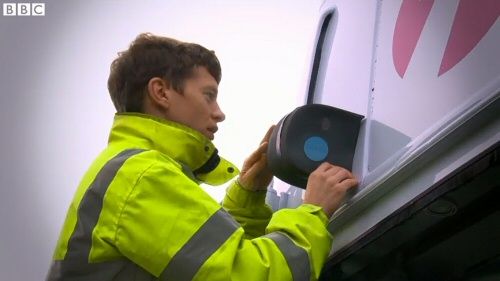
A piece of technology which has the potential to reduce the average recorded 24% of cyclist deaths that involve trucks or buses and the crashes that result in injuries is a new invention called the Cycle-Eye.
In the UK, Bristol University Innovation Centre and Fusion Processing have developed a new product to help detect cyclists and provide a verbal warning to bus or truck drivers. The Cycle-Eye uses a combination of depth sensing radar and cameras to work out whether a cyclist is riding along the left side of a bus or truck which is often against the kerb and can be within a large blind spot. In congested traffic where a bus or truck can often start and stop, a cyclist can arrive in a blind spot very quickly. With many distractions, a cyclist can sometimes be missed by the driver.


In tests conducted by Transport for London, the system recorded 98.5% accuracy. With more testing and product refinement, the technology provides a fantastic opportunity to give better information to drivers about their surroundings. All road users need to understand visibility limitations and education will always play a critical role in all road users safely sharing the same space, however where technology has the potential to increase safety of road users, it should be investigated and if it proves successful, implemented across the country.
For more information, visit the following links or contact Matthew Houlden in our Sydney office on 02 8226 8760.
http://www.bbc.com/news/technology-25316837
http://www.fusionproc.com/products/
All images sourced from http://www.bbc.com/news/technology-25316837
[1] Road Traffic Accident Data and Rates: Australia, States and Territories 1925 to 1981 Australian Government Publishing Service, Canberra, 1984
[2] Road crash casualties and rates, Australia, 1925 to 2005, Produced and published by the Australian Transport Safety Bureau, Canberra, 2007.
[3] Fitting and Wearing Of Seat Belts In Australia - The history of a successful countermeasure, P. W. Milne, (with update by FORS), Australian Government Publishing Service, Canberra, 1985
[4] Cycling injuries in Australia: Road safety’s blind spot? J Garrard, S Greaves and A Ellison
[5] AIHW: Henley G and Harrison JE 2009. Serious injury due to land transport accidents, Australia 2006–07. Injury research and statistics series no. 53. Cat. no. INJCAT 129. Canberra: AIHW.
[6] Cycling Infrastructure for Australian Cities Background Paper March 2009
[7] National Cycling Strategy 2011-16 Implementation Report, Australian Bicycle Council, 2014, Austroads Ltd. 2014
All links last accessed 8/9/14
Author: Matthew Houlden