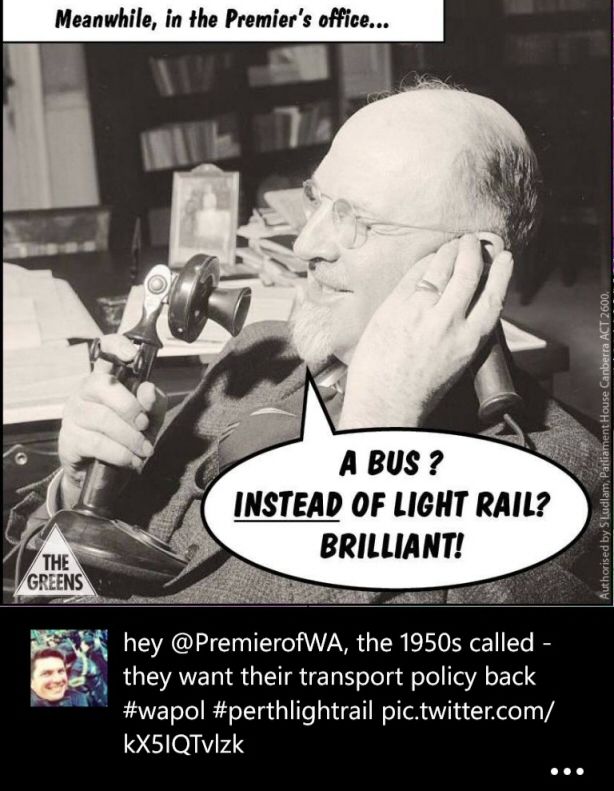
Image source: twitter.com 9 March 2015
This was put to the Western Australian Government by the Greens Senator, Scot Ludlam, over the plan being considered to replace the proposed Metro Area Express (MAX) Light Rail with a Bus Rapid Transport (BRT) system. The government is still considering it at this stage and it might also include some overseas fact finding by the Transport Minister.
What is the Project?
The WA Greens proposed the ambitious Perth Light Rail project in 2007 and the Liberal Government took the Metro Area Express (MAX) light rail project to the 2013 state election. The route extends from Mirrabooka in the north to the CBD where it splits in two; one leg heads west towards the QEII Medical Centre and the other heads east towards the Victoria Park Transfer Station via the Causeway. There is still a bit of planning to be done to work out the route through the Perth CBD and through West Perth and Subiaco, but the route is pretty much decided.
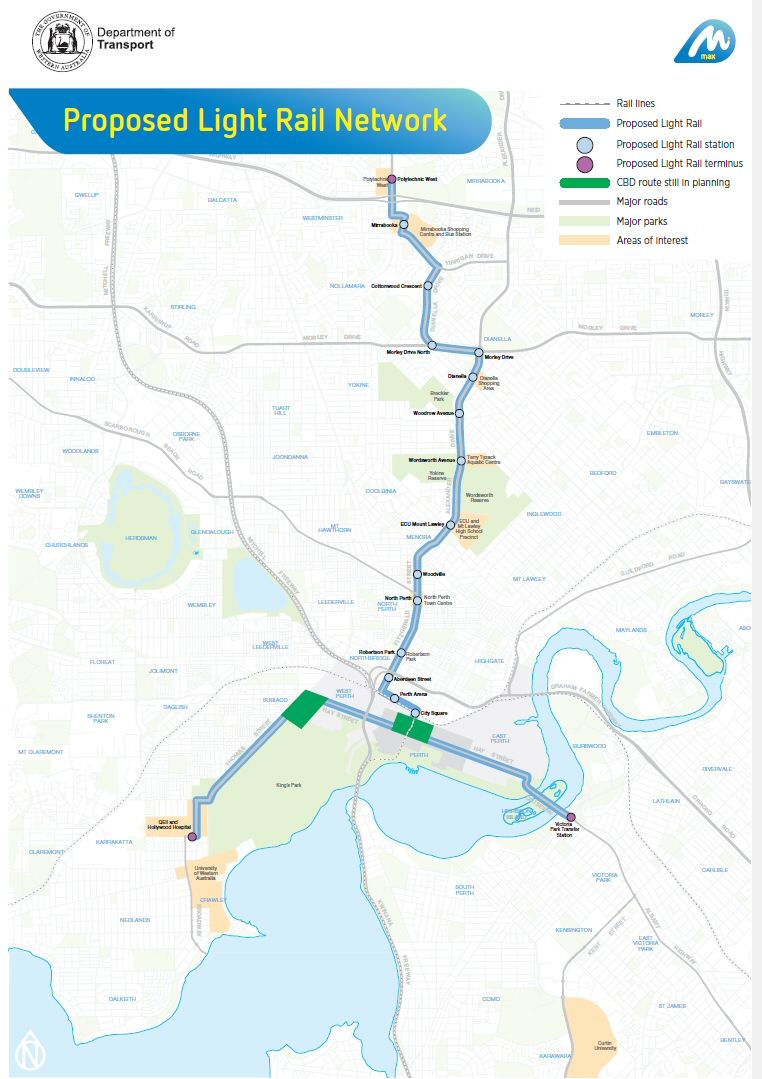
Image Source: http://www.pta.wa.gov.au/Portals/13/docs/MAX_Proposed_route_Map.pdf
Originally, the project was meant to cost $1.2 billion but a few years later, now the cost has been estimated at $2.5 billion. With the recent fall in commodity prices, the WA Government has been coming under some budget pressure and earlier this year, it was announced that the project was to be delayed by three years. Now, the WA Government is considering converting the proposed light rail route into Bus Rapid Transit or BRT for short. It is true that throughout the 1950s, many governments around the world took great delight in replacing existing tram or light rail services with bus services, but would this particular instance count as the same thing? Would this be a throwback to the 1950s?
Brief History of Light Rail and its Demise
Currently, Melbourne has the largest light rail network in Australia however Sydney had the largest network before its systematic closure and replacement with buses. In fact the Sydney closure has a slightly different story to Perth, but that is a story for another day. Trams could also be found in a number of cities all around the country until their closure around the 1950s. The Perth light rail network ran from 1899 to 1958 before it was finally closed.
Here is a photo of Perth tram route 64 as it picks up workers outside the Car Barn while turning into Hay Street.
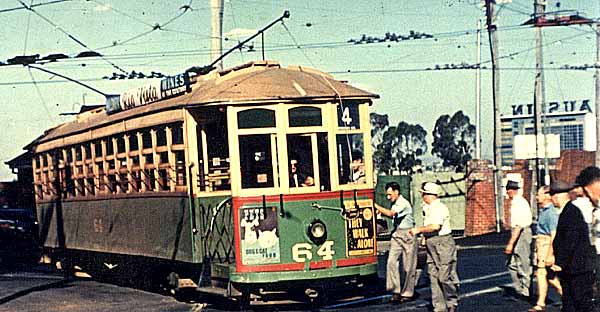
Image source: http://www.pets.org.au/pets10p.html
The following paragraphs from the Perth Electric Tramway Society explain the reasons behind the closure at the time.
“The depression followed by the war had thrown together a combination of factors which eventually proved to be lethal for the tramways: an aging tramcar fleet, aging infrastructure and years of delayed maintenance had all compounded by heavy use during the war years.
“The fact that much of the track was single, including some at the side of the road, would have meant additional expense if it were decided to modernise the tramway system.
“The shortage of funds for rehabilitation also applied to operations - buses, as well as being more flexible and cheaper to acquire, would also be cheaper to operate as they could be operated by one person, which was not possible for the Perth trams of the time.”
So it was decided, and the tram network was ripped up and replaced with buses, like this one.
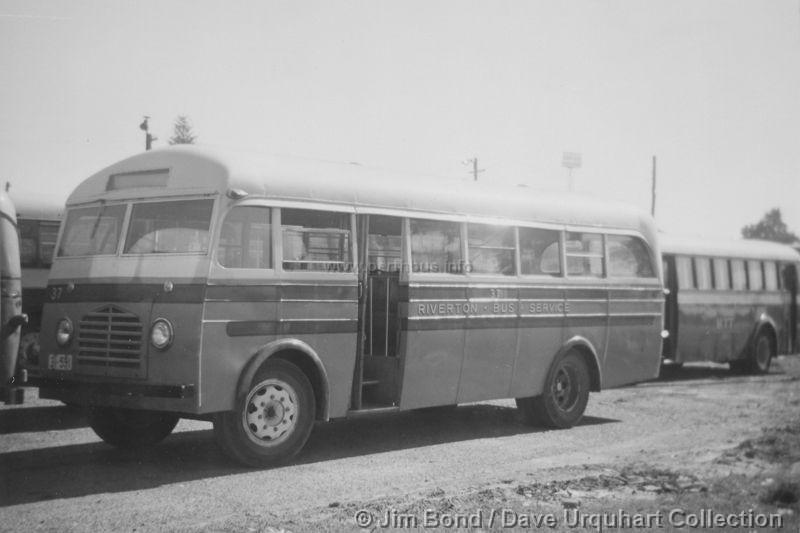
Image Source: http://www.busaustralia.com/forum/viewtopic.php?f=10&t=39218
It was a story that was played out all over Australia and soon, almost all light rail networks in the country had been replaced with buses. Although, perhaps Australia was being influenced by the happenings overseas at that time where cities all over the America were replacing their light rail networks with buses as well.
As Edward W. Miller wrote “In 1922 only one American family in 10 owned an auto. Alfred P. Sloan, Jr., GM's president, decided to change this. With friends at Firestone Rubber, Standard Oil, Phillips Petroleum and Mack Truck, Sloan began secretly, first to buy up and then destroy the rail systems in America's cities. To hide his campaign from the public eye, he hired an unknown, E. Roy Fitzgerald, as a figurehead, advertising him as an entrepreneur from the sticks. They formed a company, National City Lines, and quickly purchased Yellow Bus, America's largest diesel bus builder, and Omnibus, a bus-operating company.”
“National City Lines, headed by Fitzgerald, but privately funded by a consortium organized by Sloan and friends began buying up the rail systems in America's cities, one by one. Their approach was simple: using political know-how and money to influence city councils, while they paid Madison Avenue to tell the country "the trend was away from rail," they systematically destroyed America's clean, electric rail systems, replacing them with their polluting diesel buses. By 1941, National City Lines owned the transportation system in over 83 American cities across the country.”
It took a while but eventually people worked out what was happening and GM was put on trial and found guilty of conspiracy to monopolise the sale of buses, petrol and a range of other products. Two of GM’s management were fined $5,000 with other management staff fined $1.
“Later Justice Department investigations got nowhere, because by 1932 GM had created the National Highway Users Conference, a powerful Washington lobby to push for more freeways and silence discussion of diesel or gasoline pollution. Alfred P. Sloan headed the conference for 30 years until another GM man took over.
“With the post-WWII boom in home construction, President Eisenhower, in 1953, appointed the then-president of General Motors, Charles Wilson, as Secretary of Defense and DuPont's chief, Secretary of Transportation (DuPont was GM's biggest investor). These two set out to pave over America for the auto. DuPont got Eisenhower to set up the Highway Trust Fund which funnelled gasoline tax money into highway construction. Two thirds of these funds went to build inner-city freeways. Meanwhile, GM, recognizing the limits of bus sales as contrasted with automobiles, changed its tactics, and in 1972, convinced the House of Representatives to deny all funding for public transportation, hoping to reduce bus service. The money was diverted to freeways.”
The current Australian Federal Government has similar policies at the moment and is leaving the funding of public transport with the State Governments around the country. So the States are going it alone at the moment while freeways get all the funding from the Federal government.
Is a BRT for Perth 1950s policy?
But I digress, back to the issue at hand. Is the replacement of the Perth MAX Light Rail project with a BRT system really harking back to the 1950s?
The buses of the 1950s were a noisy, smelly, slow, hard to get in and out and quite small by today's standards. Today although yes, it is technically still a bus, some buses can carry well over 100 people (some up to 270), they can have low floors for easy boarding and alighting, multiple wide doors, air conditioning, WiFi, GPS, passenger information screens and verbal announcements of upcoming stops, just like any trains or trams could have.
Let’s take a look at a few of the BRT systems from other cities around the world.
Orange Line BRT - Los Angeles, USA
Before this dedicated right-of-way for buses was installed, the journey used to take 81 minutes on normal buses but using the BRT system which opened in 2005, the journey takes an average of between 44 and 52 minutes. If a bus is late, more green time is provided to the busway to help the bus catch up to the timetable. The system was originally designed to cater for between 9,000 and 12,000 people per weekday but in February 2015, the system was carrying approximately 30,000 people on a weekday. The routes also includes dedicated bicycle lanes along its entire length.
Here is a picture of a typical Orange Line bus at a stop.
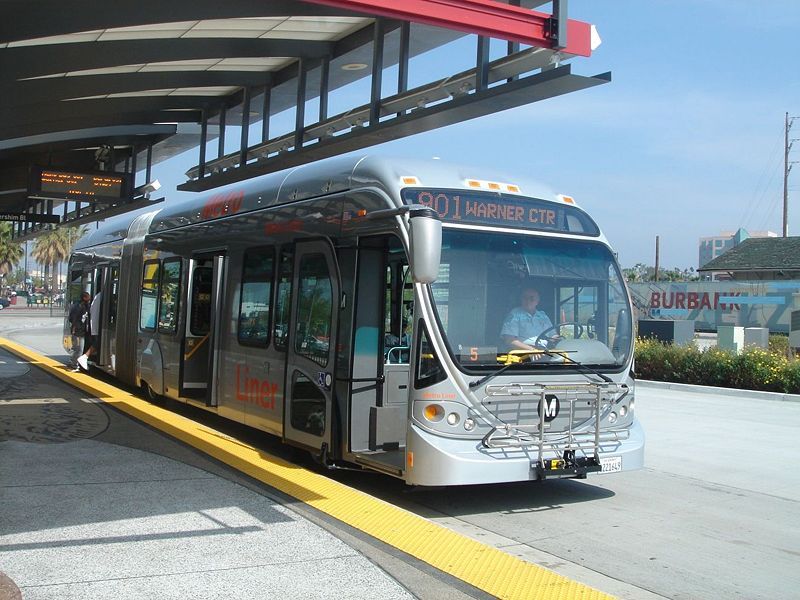
Attribution: Cian Ginty – Source: http://upload.wikimedia.org/wikipedia/commons/thumb/e/e7/LA_metro_liner_with_bicycle_rack.jpg/800px-LA_metro_liner_with_bicycle_rack.jpg
You can see in the picture above that the bus has 3 wide doors, a low floor and a bike rack on the front. The stops have a roof, real time information and are raised to provide easy boarding for customers. All ticket selling is done off the bus which makes boarding and alighting easier and quicker than buying a ticket from the driver. All of the buses have space for 3 bikes on the front which helps integrate the system into the wider transport network of the City.
Brisbane Busway - Brisbane, Australia
The Brisbane Busway is a network of 27km of dedicated bus lanes. Since opening in 2001, the network been expanded a number of times and further expansion is being considered. The stations are of high quality and feature real time information and passing lanes to increase capacity. All tickets are sold off the bus which provides quicker boarding and alighting time when compared to a conventional bus.
Here is a picture of the Brisbane Busway. You can see the seating, shelter and real time information.
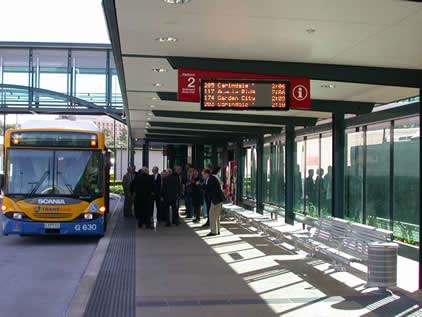
Image Source: http://www.nbrti.org/media/gallery/busway/pages/busway-1.htm
Rede Integrada de Transporte - Curitiba, Brazil
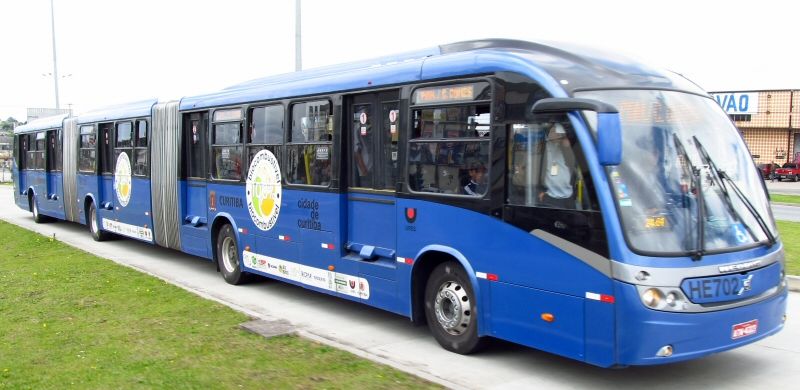
The system in this city is one of the most famous BRT systems in the world and was opened in 1972. The system has expanded over the years and is so successful that 75% of people in the city take the bus to work. There is no comparison to any Australian city but the point of showing this example is to demonstrate what can be achieved with good planning and dedicated running lanes for public transport, whatever the mode.
Here is a picture of one of the modern buses to use the BRT system. This particular bus runs on 100% soybean-based biodiesel.
Attribution: Luiznp - http://upload.wikimedia.org/wikipedia/commons/3/36/Curitiba_BRT_RIT_550PINHEIRINHOCARLOSGOMES_B12M.JPG
Revitalising a City - BRT vs Light Rail
The brief examples above do little to explain the impact on an existing City when retrofitting existing roads or public transport routes and the benefits of investment or benefits to individuals. A number of studies have been done which looked at how the implementation of BRT projects within cities have impacted on property prices or investment. A brief summary is as follows:
- Seoul, Korea - Land prices are 10% higher within 300m of BRT stops and retail or other non-residential uses are 25% higher within 150m of BRT stops. In addition, employment density increased 54% within 500m of BRT stops.
- Bogata, Colombia - After normalising the data for the structure of the surrounding properties, neighbourhood characteristics and walking distance to the BRT corridor, for every 5 minutes of extra walking, rental prices decrease between approximately 7% and 9%.
- Pittsburgh, USA - Considering all other variables the same, a property approximately 300m away from a BRT stop is worth around $10,000 less than a property around 30m away from the stop.
- Cleveland, USA - The investment in the Healthline BRT resulted in $5.8 billion in investment which equates to $114 for every dollar invested in the transport network itself.
Looking at the light rail examples, while there are similar examples of successful projects it appears that it takes more than one variable to encourage investment as explained by Professor David Levinson.
" We have no evidence that streetcars, of themselves, promote economic development in the context of present-day US cities. That is, there is no case where modern streetcars were built, nothing else was done by the public sector (no road reconstruction, no public subsidies for development, no change in development regulations), and the level of private sector economic development changed measurably, and more than in an otherwise comparable control case."
It is hard to compare previous light rail and BRT project examples because there are no two projects that are identical.
Having said that, the origins of transport projects are often similar. Transport projects are usually developed top-down, that is, it is often the political leaders or leaders of transport agencies that propose transport projects, which include the mode. What might allow for a better debate is for the same leaders to decide they want a transport corridor through a certain area and to identify the number of people that they want to move through that corridor.
Options could then be developed based on some standard criteria along with detailed costings for discussion by the public about the benefits and costs of each mode of transport. With all things like travel time and capacity being even, the public will get a better chance to decide how much they want to spend and whether light rail is really better than say, BRT. When the transport mode is decided from the start, it can often skew the debate.
Personally, I don't really have a preference over either mode and for me, my choice comes down to speed and reliability. I grew up in Melbourne so understand the benefits that trams can provide and how they can contribute to the amenity of an area. I have also been to Nice in France and have seen the benefits that a transport project like the proposed Perth MAX Light Rail project could provide to the city.
When regularly commuting, currently I have two options; I can take the train or I can take the bus. I know how long the train will take but it is a 10 minute walk to get there and a similar walk at the other end. The bus stop is right outside my house and drops me off right at my destination, but can take longer if there is more traffic. In most cases, it is the reliability that sways me because both modes take the same amount of time if all things go smoothly.
Ultimately, whether a light rail option or a BRT option is successful for Perth will come down to a number of factors:
- Will the transport route be on a dedicated corridor to ensure reliability of service?
- Will the transport route provide for a high enough frequency and for enough hours during the day to attract people to use it?
- Will the system be able to transport the required number of people?
- Will the system include off-vehicle ticket purchasing at all stops?
- Will the system use the latest technologically advanced vehicles that maximise passenger comfort and safety?
- Will the stops and urban design along the route be of high quality and encourage pedestrian activation around them?
- Will bicycles, taxis and other transport modes be integrated into the new corridor?
- Will higher density zoning be considered around new stop locations to encourage investment and development?
From an environmental perspective, if you run the electric light rail vehicles on renewable energy then the impact on the environment will be lower operationally, however buses are quickly catching up and there are various diesel hybrid options that produce significantly fewer emissions than they did even 10 years ago. Also, as shown above, there are buses that run on soybean-based biodiesel. It also gets even more complicated when you consider the latent energy required to construct each of the options. But environmental impact is only part of the consideration here. There are also social, economic and amenity issues to consider along with the end users.
Based on the evidence of successful BRT projects around the world, I would argue that it is not necessarily 1950s transport policy and it doesn't matter which mode is chosen for the Metro Area Express, so long as all the other factors that I mentioned above are equal and the latest planning, design and technology is used.
We will continue to watch with interest over the coming months until a final decision has been made by the WA Government.
Author: Matthew Houlden
References:
http://getthebiggerpicture.wa.gov.au/max-light-rail/
http://www.busaustralia.com/forum/viewtopic.php?f=10&t=39218
http://www.busaustralia.com/forum/viewtopic.php?f=7&t=80104
http://www.pta.wa.gov.au/Portals/13/docs/MAX_Proposed_route_Map.pdf
http://www.pets.org.au/pets10p.html
http://www.verdant.net/natlcity.htm
http://streets.mn/2013/09/11/does-brt-have-economic-development-effects/
http://streets.mn/2013/08/26/do-streetcars-promote-economic-development/
https://www.youtube.com/watch?v=Ar7fF_oOcVI
http://www.metro.net/news/ridership-statistics/
http://www.chinabrt.org/en/cities/brisbane.aspx
http://www.treehugger.com/cars/curitibaatms-bus-rapid-transit-23-million-passengers-a-day.html
All referenced last accessed 23/3/15

