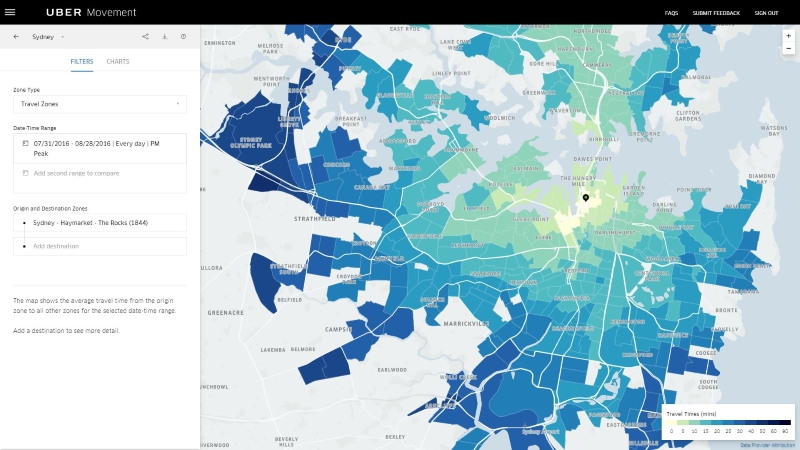
Image Source: movement.uber.com
You know all those Uber trips that you have been taking? Uber has been collecting the data over the last few years and now they have enough, they have been able to put it together in an interesting way that has excellent potential for transport planning and traffic engineering.
The data can be accessed through www.uber.movement.com although you need to be an Uber member to access the data. Currently data for Bogotá, Washington DC, Boston, Manila and Sydney are available with more planned to be released in the future. The data is only a sample of the millions of trips that have been taken using Uber since its inception in 2009. Only trips from 2016 are currently available for analysis and comparison.
The website allows you to look at individual zones across each city to understand the travel times to other parts of the city for different times of the day and throughout the year. For every zone, assuming there are enough trips, you are able to make a number of comparisons.
Let’s say it’s a weekday afternoon and you are in the middle of the CBD and you call and Uber…the image above shows how far can you get in 30 minutes?
You can also compare two different periods of time. The maximum length of time you can select is 3 months.
As a city that is a favourite destination for tourists who come to enjoy Sydney’s beaches, traffic always seems to be worse in summer. This can now be tested with the real trips that were undertaken by customers. Let’s say you are in the Sydney CBD and you want to go to Bondi Beach.
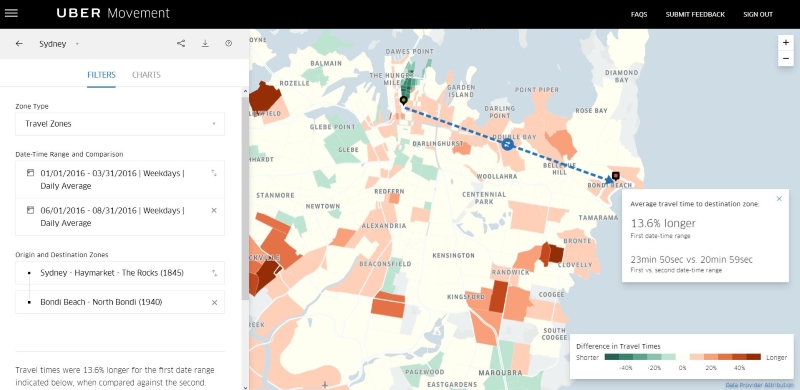
Image Source: movement.uber.com
The average trip on a weekday is around 3 minutes longer in the three months of summer than in the three months of winter. We also tested the trip from Bondi Junction to Bondi Beach and the difference was even higher between summer and winter.
We will need to look into the database more to understand its limitations before using it on projects. For example, you don't know what route the customers took and you don't know how many customers travelling from work to home, stopped at the shops to buy milk along the way. There is also no indication on what the minimum number of trips is or how many trips the database to an from each zone includes. This would be understood if you could access the raw data behind the website.
But the scope and usability of the data looks promising and it is positive for transport planning and traffic engineering to have another data source for travel time, as it is often hard to find data at a large enough scale to be useful.
Possible uses at a larger regional or city-wide scale include:
- Planning for missing links in the public transport network.
- Looking for improvements to the public transport timetable.
- Looking at variations in travel time across a wide area during road works or after closing a road.
Over time, there will probably be many other uses that will emerge and hopefully, Uber continue to improve the website and the type of data which can be accessed. There are many cities around the world where Uber is illegal and having a carrot of current transport planning and traffic engineering data like this may help their cause.